

Age-Graded Running Calculator
The age-graded running calculator compares your road-race time with the 2025 USATF MLDR standard for your age, distance and male or female reference table. It gives you an age-grade percentage, an open-age equivalent, your age standard and the exact factor used.
Your Age-Grade Percentage
—
- Actual pace
- —
- Age-graded pace
- —
- Age factor
- —
- Open standard
- —
- Source table
- —
This result compares a road-race time with a statistical standard. It doesn't measure health, training status or race conditions.
How The Same Time Grades At Other Ages
| Age | Age Standard | Age Grade | Age-Graded Time | Class |
|---|
The highlighted row is your selected age. Other rows hold the same finish time, distance and reference table constant.
How the age-graded running calculator works
The age-graded running calculator takes four things from your result: age on race day, the male or female reference table, road distance and finish time. It then looks up the matching factor in Alan Jones’s 2025 road-running tables. Those tables cover every whole age from 5 through 100 and 22 named distances from one mile to 200 km.
The source publishes two sex-based reference tables, so you’ll choose the table used in the calculation. This source field refers to the way the standards are classified, while gender identity sits outside the calculation. And because this release contains road standards, you’ll need the separate track tables for a track mile, even though the distance matches a road mile.
Enter the official elapsed or net time you’re comparing and keep that timing choice consistent across results.
Your age grade can then help you compare two of your road races when the distances or ages differ. But you’ll keep a race prediction separate, because this calculation explains a finished performance rather than forecasting your next one. When you’re comparing results later, the original timing method should stay with each entry.
If you only need pace from time and distance, use the Mile Pace Calculator. Age grading adds a performance standard to that arithmetic, so it’s answering a different question and giving you a separate comparison value.
What your age grade, factor and equivalent time mean
Your age grade is the age standard divided by your actual finish time, multiplied by 100. The age standard is the source table’s reference time for one age, sex table and distance. Matching it gives 100%, which means it’s the fixed reference behind your result.
Age standard = open standard ÷ age factor
Age grade = age standard ÷ actual time × 100
Age-graded time = actual time × age factor
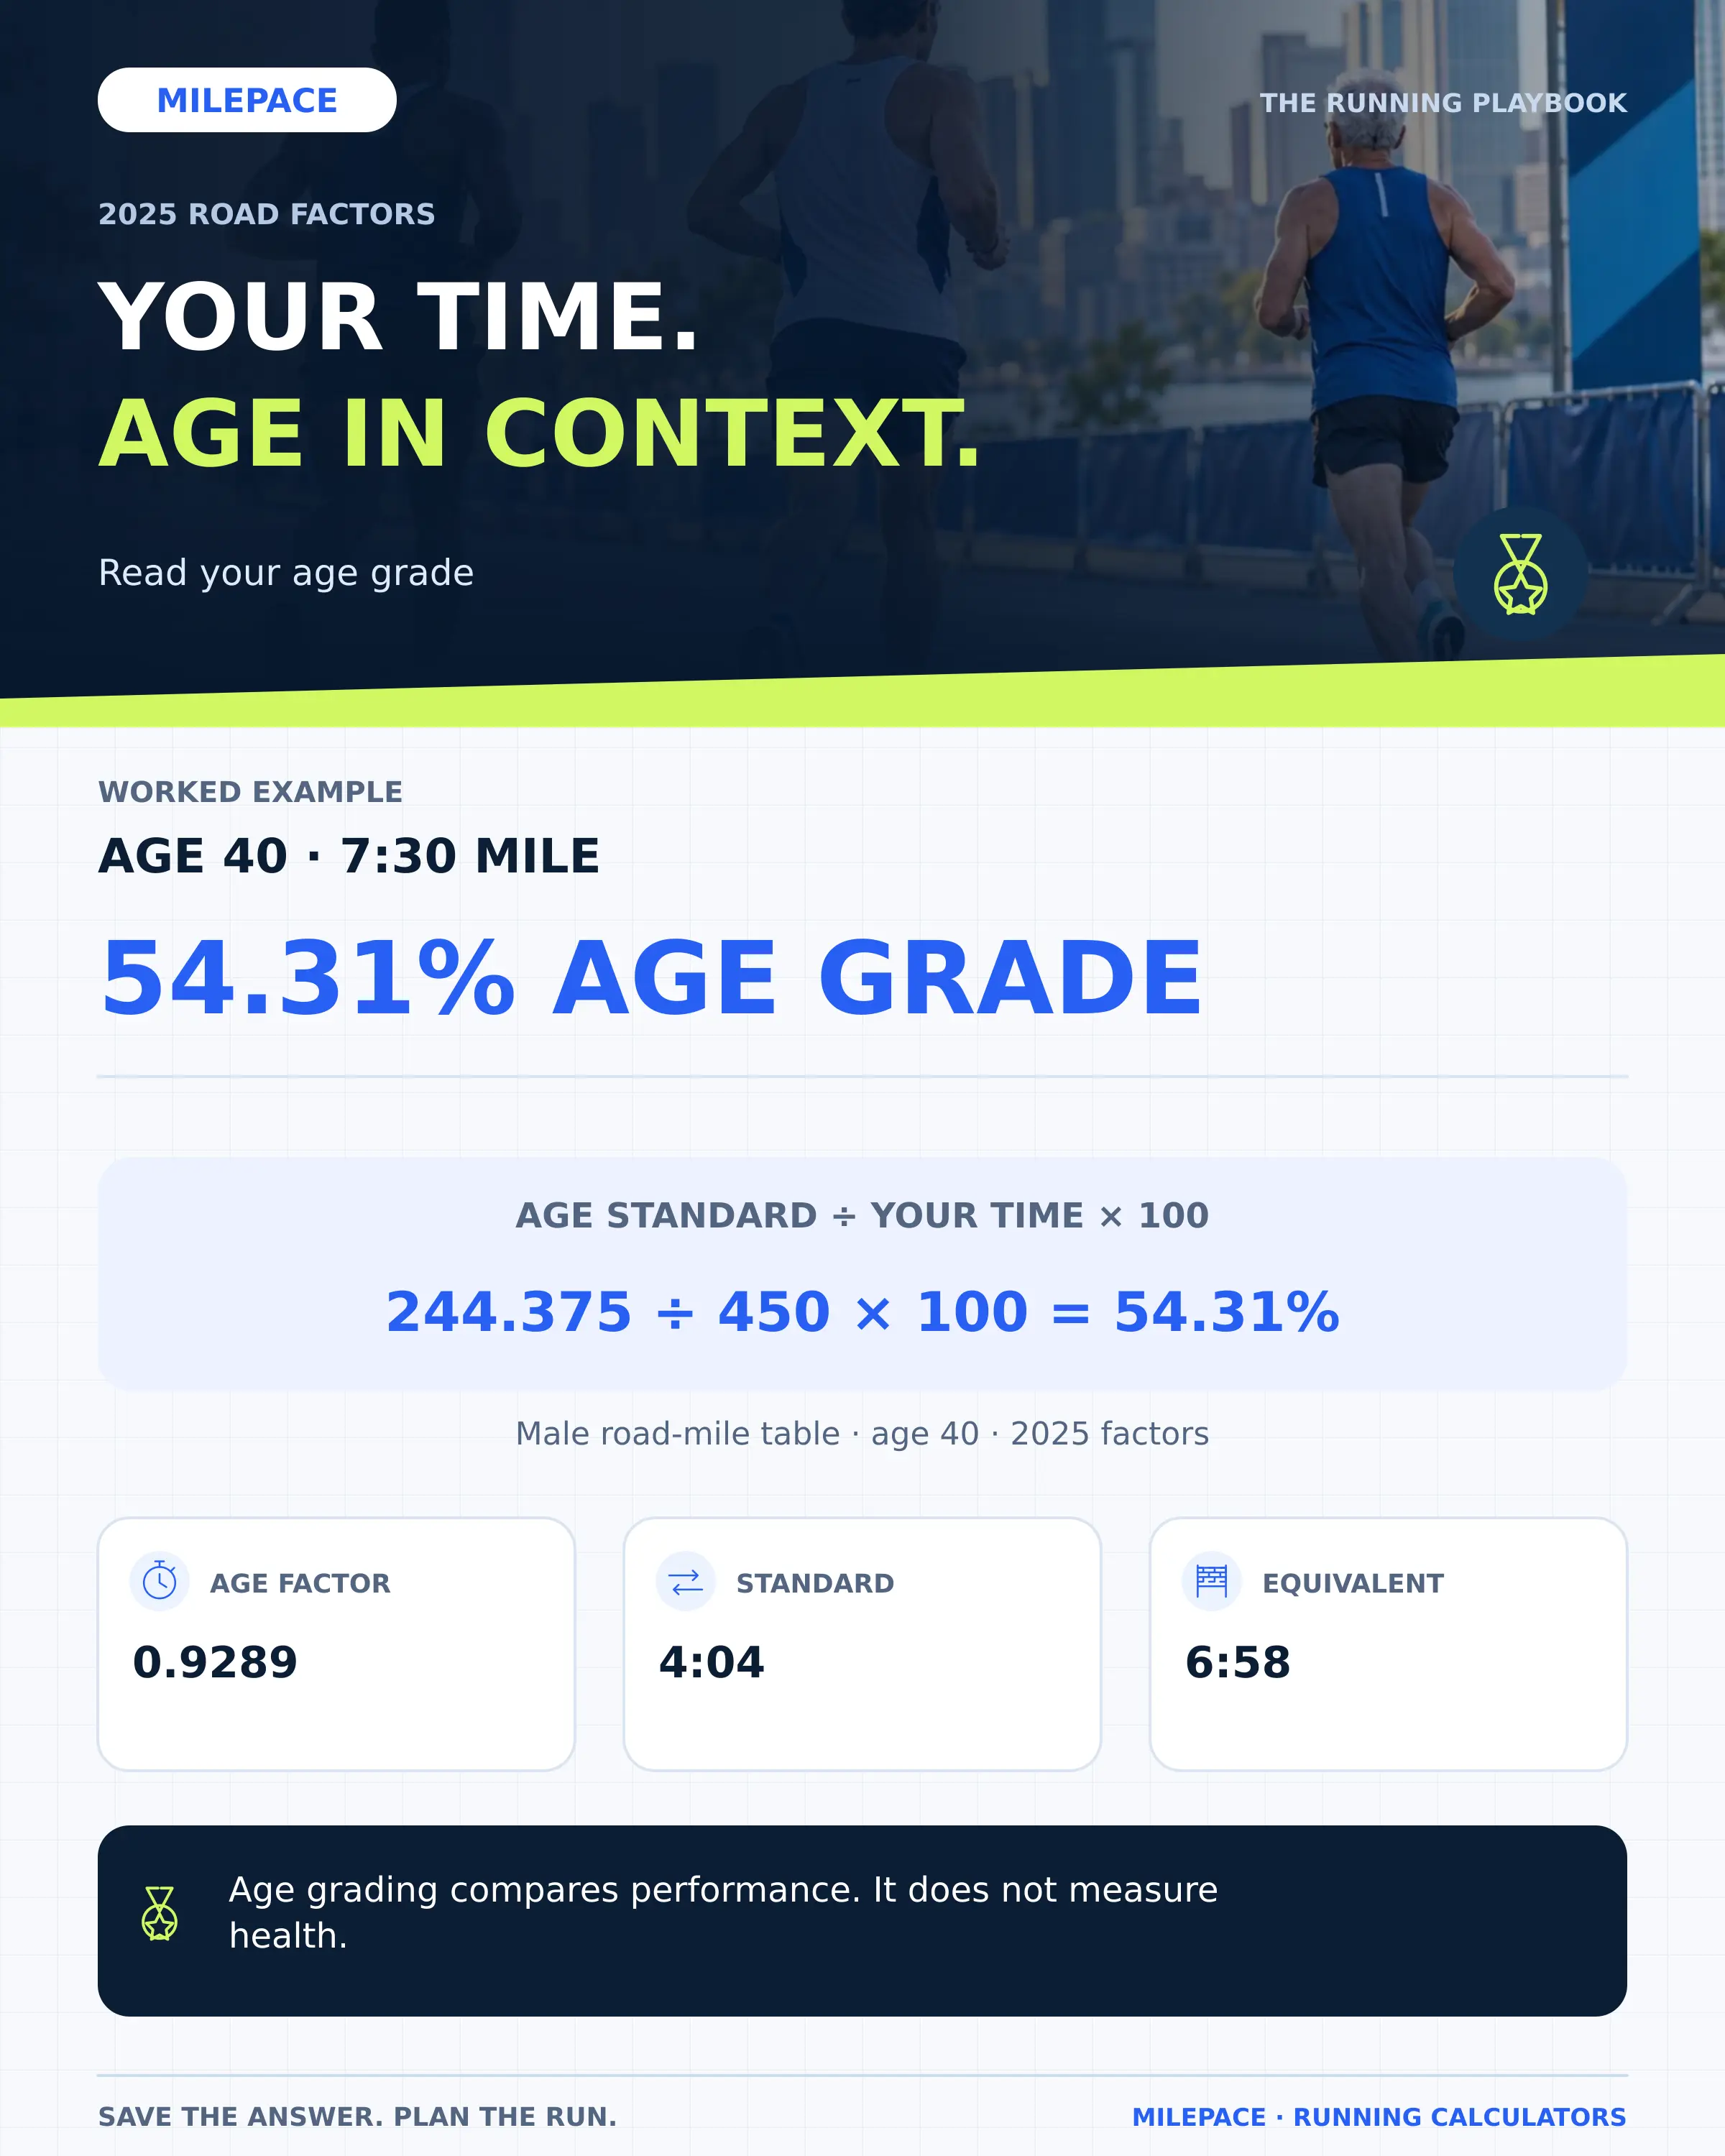
For instance, the 2025 male road-mile open standard is 3:47. At age 40, the mile factor is 0.9289 and the resulting age standard is about 4:04. A 7:30 mile therefore gives 54.31%, while its age-graded time is about 6:58. The result card shows every part of that calculation, so you’ll be able to verify the basis of the percentage yourself.
The class label follows the commonly used USATF interpretation: 60% local class, 70% regional class, 80% national class, 90% world class and 100% approximate age-standard level.
USATF Utah’s circuit explanation publishes those typical thresholds. They’re broad performance labels for comparison, while medical fitness and likely race placing depend on different information. So you’ll want to keep the label attached to its narrow purpose.
Age grade is different from average running pace by age
An average running pace by age table describes the runners included in one dataset, while age grading uses modeled standards based on leading performances. So if you’re asking, “What is a good running pace for my age?”, they’re two separate comparisons and they’ll give you different information.
The mile-time guide shows observed one-mile race medians by age and sex from a named 2025 race sample. That’s the useful place to compare your mile with other finishers in those groups. This calculator tells you how close the same result is to the standard for your exact age, which means a 42-year-old and 48-year-old each receive their own factor.
For example, average pace per mile from a 5K covers a different performance from an all-out one-mile time.
A 25:00 5K averages about 8:03 per mile, but your age grade must still use the 5K row because the result covered 5,000 meters. Choosing Mile would compare your clock with a different event. Also, keeping the full event distance with the pace means you’ll understand the saved result later.
Use the comparison table below your result when you want to isolate age. It’ll keep your distance and finish time unchanged, then show how the source factor changes at five-year ages and at the exact age you entered.
Worked age-grading examples for a mile, 5K and half marathon
For instance, a 60-year-old using the female road table with a 25:00 5K receives a factor of 0.7621. The calculator gives an age-graded time of about 19:03, an age standard of about 18:14 and an age grade of 72.96%. That puts the result in the regional-class band under the threshold labels above, while the original finish remains 25 minutes.
For another example, a 65-year-old using the male table with a 2:00:00 half marathon receives an age grade of about 62.30% and an age-graded equivalent of about 1:32:19.
Those numbers come from the half-marathon standard, so they preserve the event you actually completed. Multiplying a separate mile comparison across 13.1 miles would answer another question and lose the distance-specific factor. And when you save the calculation, both the selected event and original time stay beside the percentage.
| Result field | What it uses | Why it matters |
|---|---|---|
| Actual pace | Your finish time and race distance | Describes the pace you recorded |
| Age factor | Exact age, table and distance | Connects your result to the 2025 standard |
| Age standard | Open standard divided by factor | Represents 100% for the selected inputs |
| Age-graded time | Actual time multiplied by factor | Provides an open-age equivalent |
| Age grade | Age standard divided by actual time | Lets you compare percentages across supported road events |
You can select the road mile, 5K, 6K, four mile, 8K, five mile, 10K, seven mile, 12K, 15K, ten mile, 20K, half marathon, 25K, 30K, marathon, 50K, 50 mile, 100K, 150K, 100 mile or 200K. The result always names the 2025 table revision, factor and selected event, giving you the specific basis needed for another comparison.
Road-table limits you should keep with the result
This tool uses the 2025 USATF Masters Long Distance Running road factors, approved on January 10, 2025. The current USATF calculator directory links to the Masters LDR age-grading calculator. Track, field and race walking use their own tables, and this page stays with the road release throughout your calculation.
Age grading leaves hills, heat, altitude, wind, surface, drafting, course measurement error and any stop you included in the clock unchanged.
For example, two races in very different conditions can still produce useful percentages, but the weather and course differences remain part of your comparison. You can add those details to your saved notes rather than assuming the age factor corrected them. Also, use the same elapsed or net timing choice when the purpose is to follow your own progress.
A score above 100% is mathematically possible when a performance is faster than the published age standard. In that case, check the distance, time, age, selected table and source revision first. A valid result can remain above 100%, which keeps the arithmetic visible.
The standards are solely performance comparisons. Medical safety, training frequency and a suitable target depend on information beyond this percentage, so your score should remain one part of the larger decision.
Save and compare your age-graded results
Save a valid result to My Mile when you want the inputs and outputs together. The saved card includes your age, table, distance, finish time, percentage, factor, equivalent time and comparison table. Your records stay in this browser, and you’ll be able to export a backup before changing device, browser or domain.

For the cleanest comparison, use official results from measured road events and note the conditions that might explain a change.
For instance, a higher percentage at a shorter race says that performance was closer to its selected standard. Your best future target can still depend on preference, training and the event you’re planning to enter. So keep the percentage as a comparison rather than turning it into an automatic race choice.
When you revisit the calculation after a birthday, change only the age if you want to see the age-factor effect. If you also replace the race result, both your performance and the standard have changed. That’s why the table makes the distinction visible and keeps both values beside your selected event.
Frequently Asked Questions
What is a good age grade for running?
The common USATF labels start local class at 60%, regional class at 70%, national class at 80% and world class at 90%. Use them as broad comparison bands, with your event, conditions and reason for running kept beside the percentage.
Which age should I enter in a running age-grading calculator?
Enter your age in whole years on the day of the race, even if you will have another birthday later in the same year. That keeps your input aligned with the performance date you are comparing.
Can I use this as an average pace calculator by age and gender?
This tool calculates an age grade from performance standards. For a population-style comparison, use the linked mile-time guide and its observed mile-race medians by age and sex, then keep the stated sample limits in view.
Why does my age-graded time look faster than my actual time?
For most adult ages where the factor is below 1, multiplying your time by that factor produces a faster open-age equivalent. Your physical finish stays unchanged, while the equivalent gives you a common reference for another supported result.
Can I age-grade a treadmill or track result here?
This version uses the 2025 road tables. Treadmill running lacks a measured road course, while track events use separate standards, so those results belong with calculators built for their correct surface and table.